Web Dashboard
A real-time monitoring and management UI for your Conveyor job queues. Ships as three packages:
@conveyor/dashboard-- the full dashboard (API + embedded UI)@conveyor/dashboard-api-- headless REST API only@conveyor/dashboard-client-- typed HTTP + SSE client for the API
Features
- Real-time updates -- SSE-powered live view of job state changes across all queues
- Queue management -- pause, resume, drain, clean, and obliterate queues
- Job detail -- inspect payload, options, attempt history, stacktraces, and progress
- Flow visualization -- browse parent/child job trees
- Metrics charts -- throughput sparklines and per-queue metrics (minute/hour granularity)
- Command palette --
Cmd+Ksearch for jobs by ID, queue, job name, or payloads - Advanced search -- dedicated
/searchpage with combinable filters (name, queue, states, date range) and pagination - CSV / JSON export -- one-click download of the current job list or search results
- Group monitoring -- per-group active/waiting counts
- Bulk operations -- retry all failed jobs, promote all delayed jobs
- Read-only mode -- disable mutation endpoints and hide mutation controls in the UI via a single flag
- Auth hook -- plug in JWT, basic auth, or any custom auth logic
- Custom base path -- mount the dashboard under any URL prefix
Quick Start
deno add jsr:@conveyor/dashboard jsr:@conveyor/store-memorynpx jsr add @conveyor/dashboard @conveyor/store-memorypnpm dlx jsr add @conveyor/dashboard @conveyor/store-memorybunx jsr add @conveyor/dashboard @conveyor/store-memoryimport { createDashboardHandler } from '@conveyor/dashboard';
import { MemoryStore } from '@conveyor/store-memory';
const store = new MemoryStore();
await store.connect();
const dashboard = createDashboardHandler({ store });
Deno.serve({ port: 3000 }, (req) => dashboard(req));
// Open http://localhost:3000TIP
Use the same store instance for your Queue, Worker, and the dashboard so it sees all jobs in real time.
Screenshots
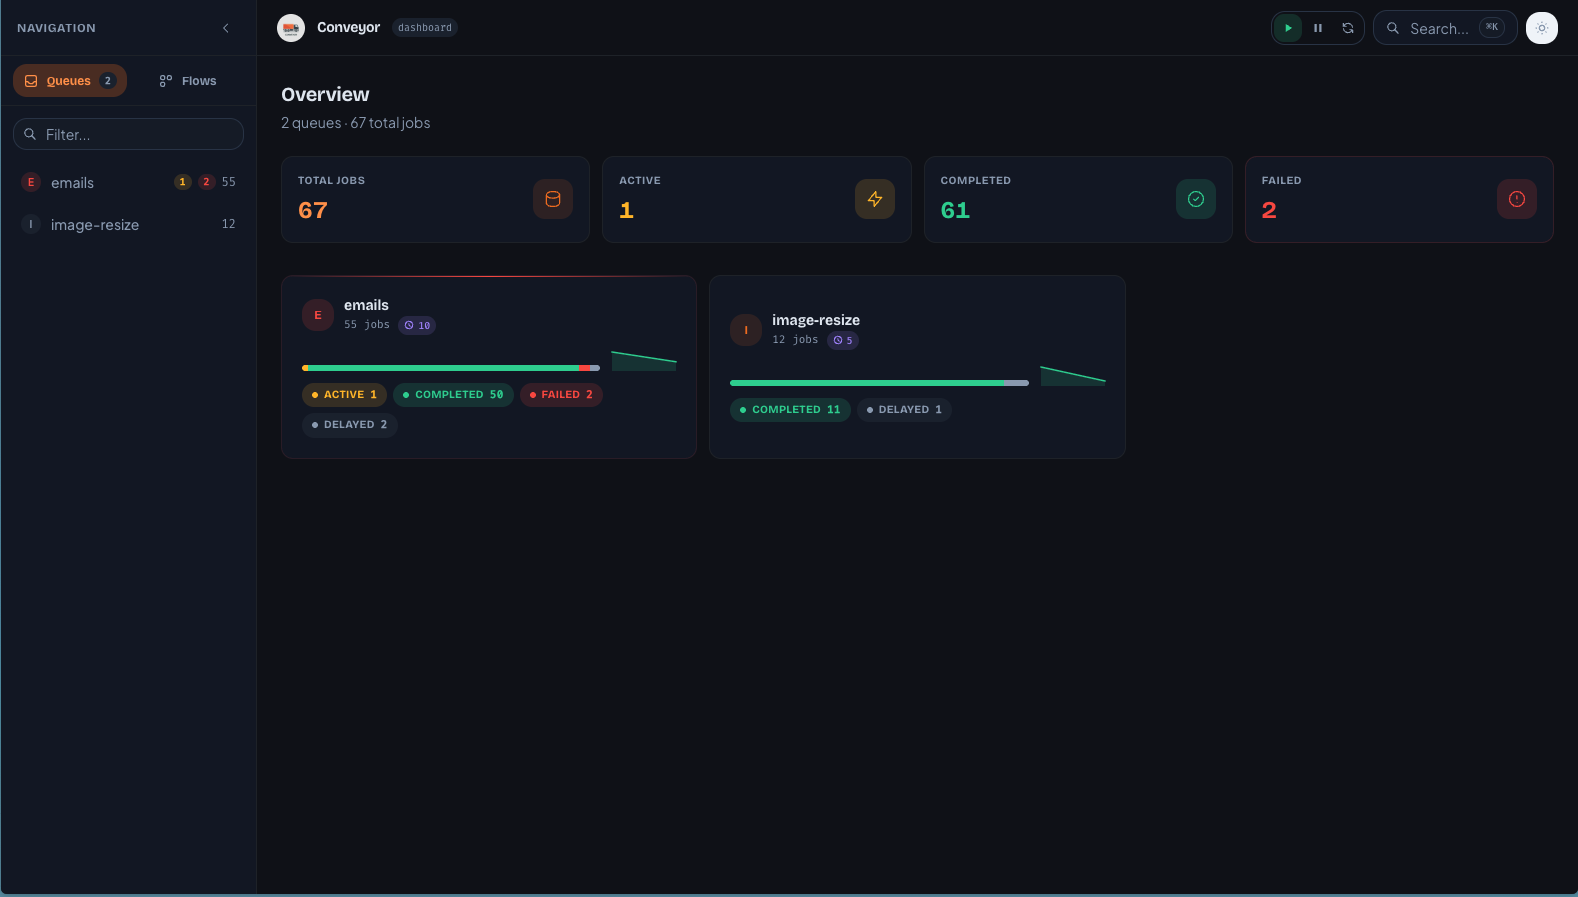
Queue Overview
The home page shows all queues with job counts, state distribution, sparkline throughput, and scheduled job indicators.
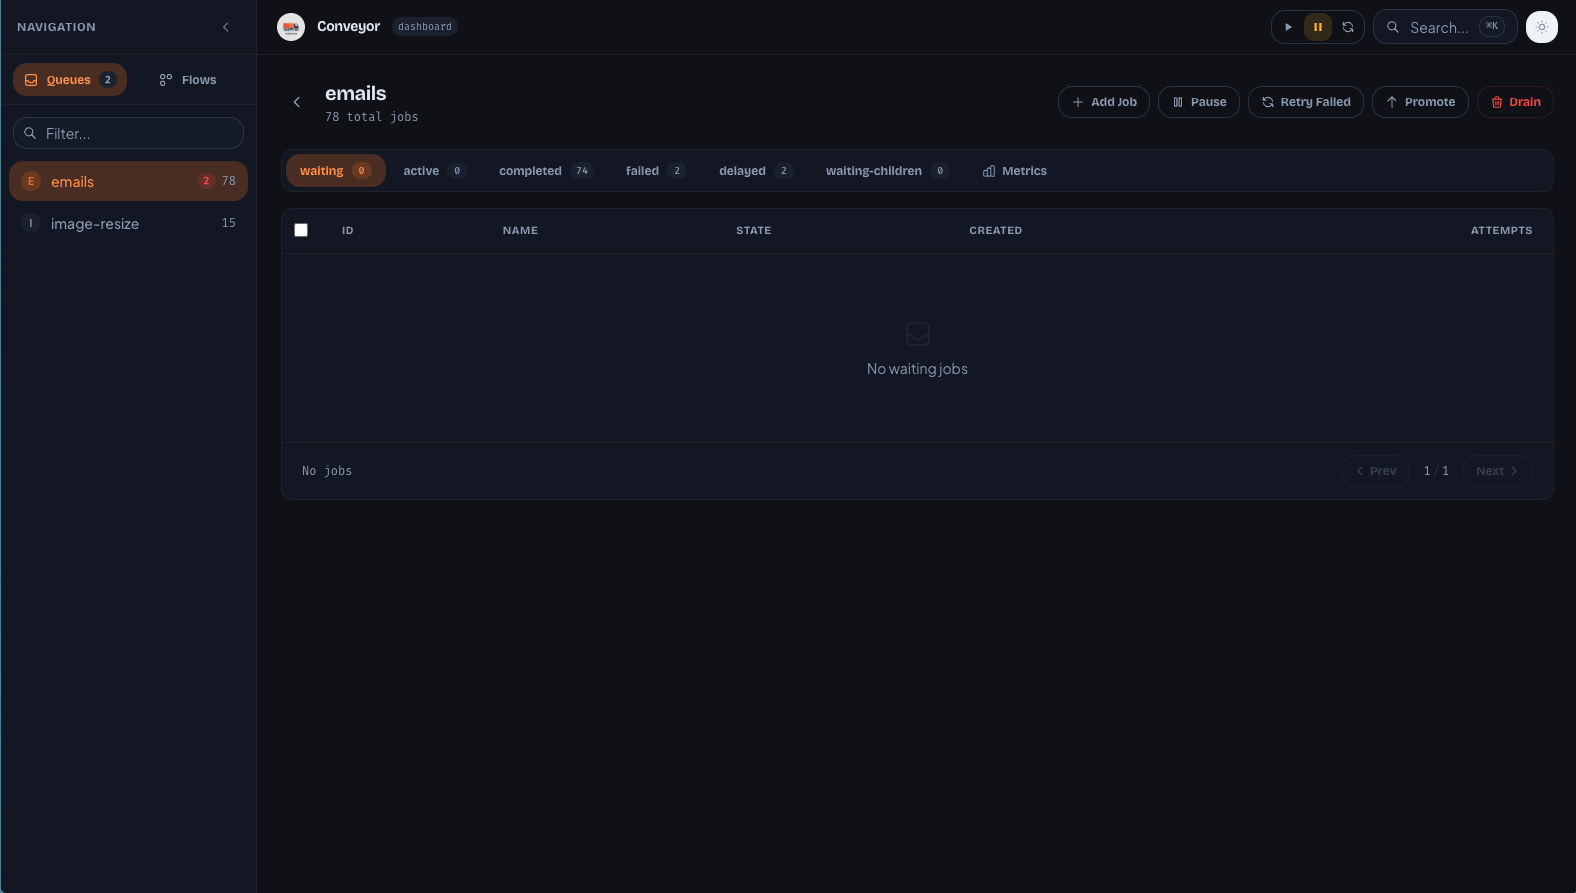
Queue Detail
Drill into a queue to see jobs by state, with bulk selection, cron/repeat/flow/child/group tags, and inline metrics.
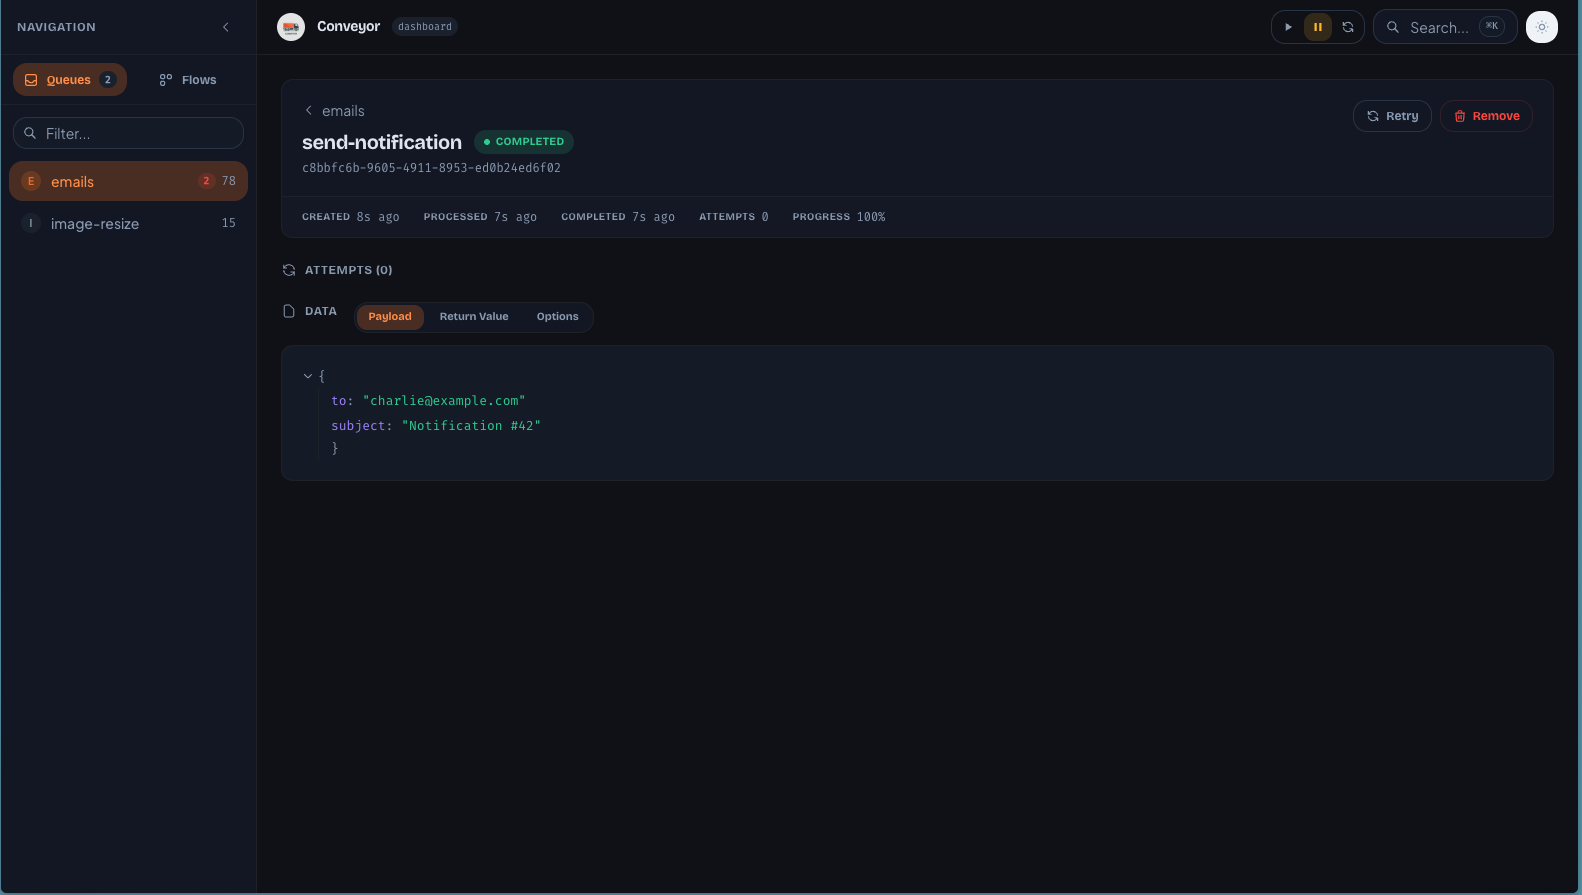
Job Detail
Inspect a job's payload, options, return value, per-attempt logs and stacktraces, and timeline metadata.
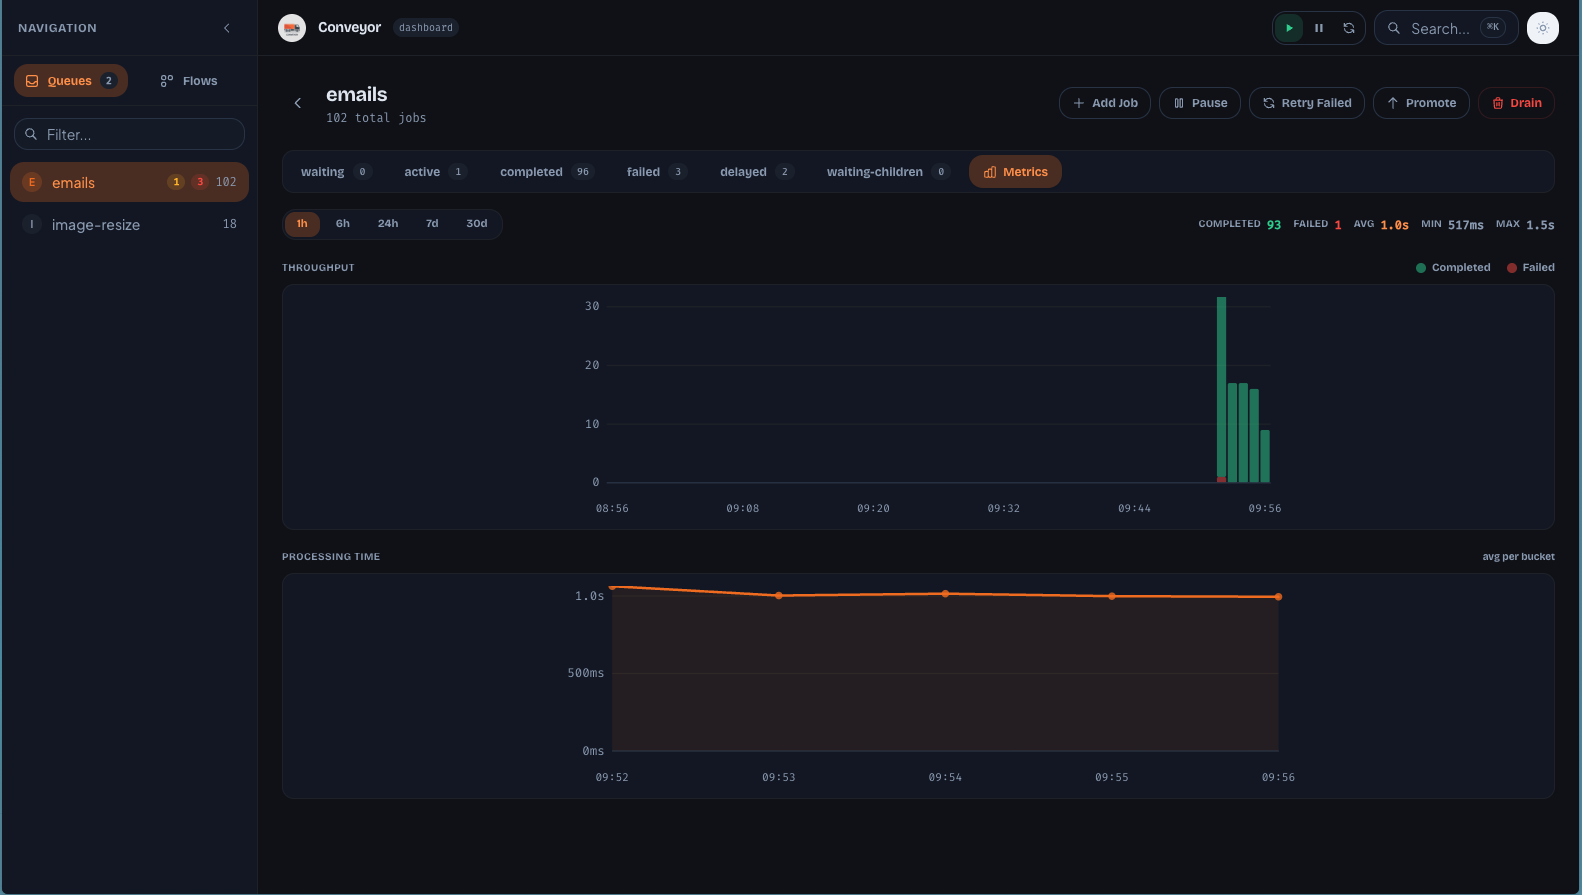
Metrics
Throughput bar charts and processing time area charts with time range selector (1h to 30d).
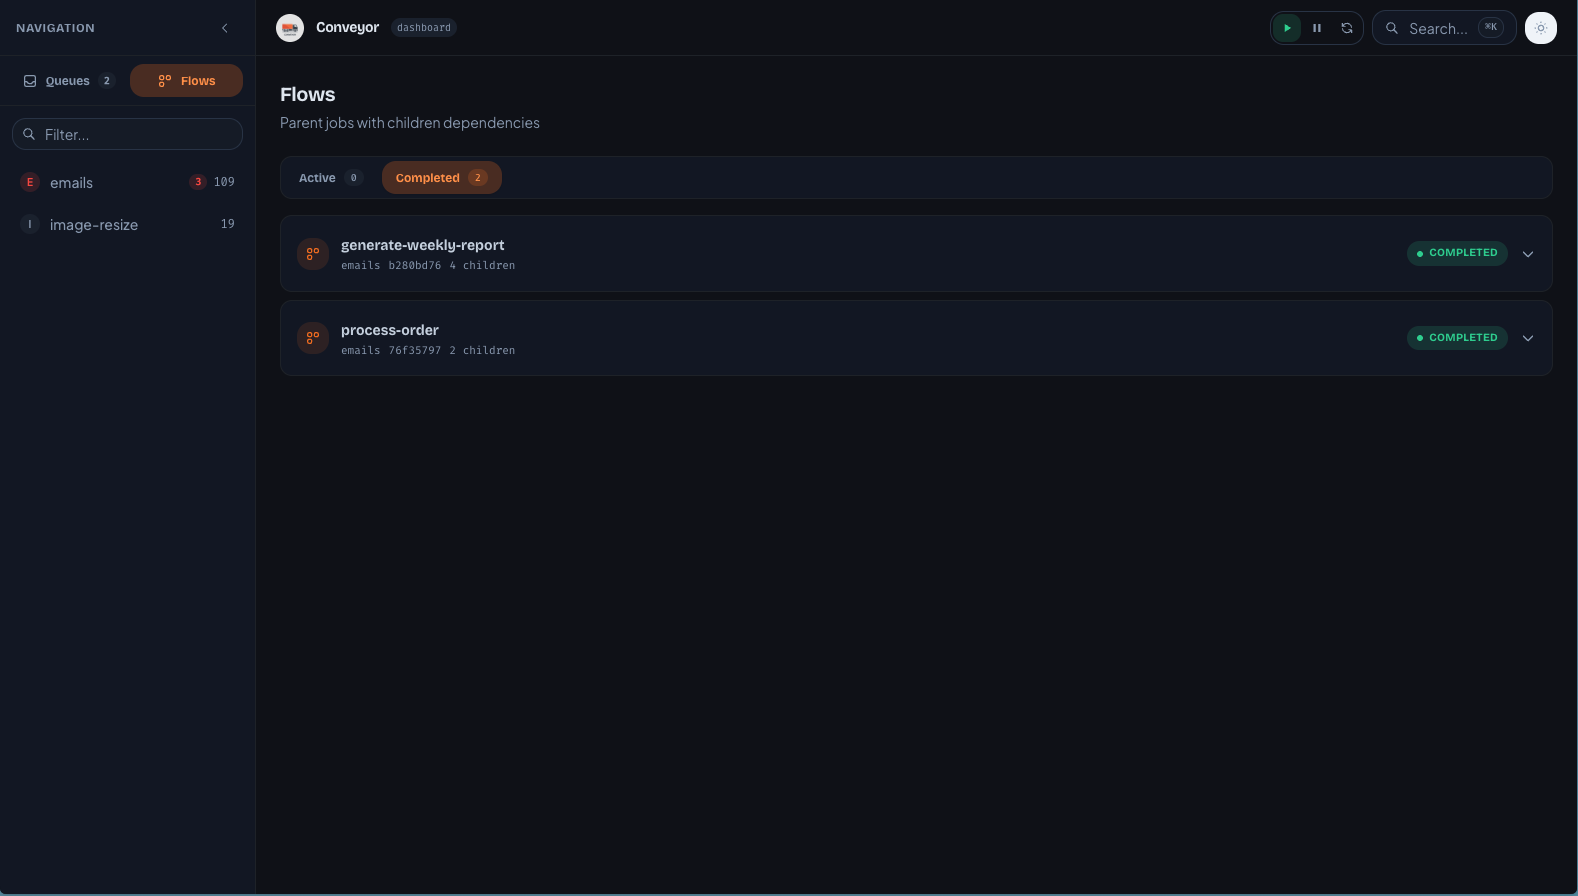
Flows
Browse parent/child job flows with active and completed tabs.
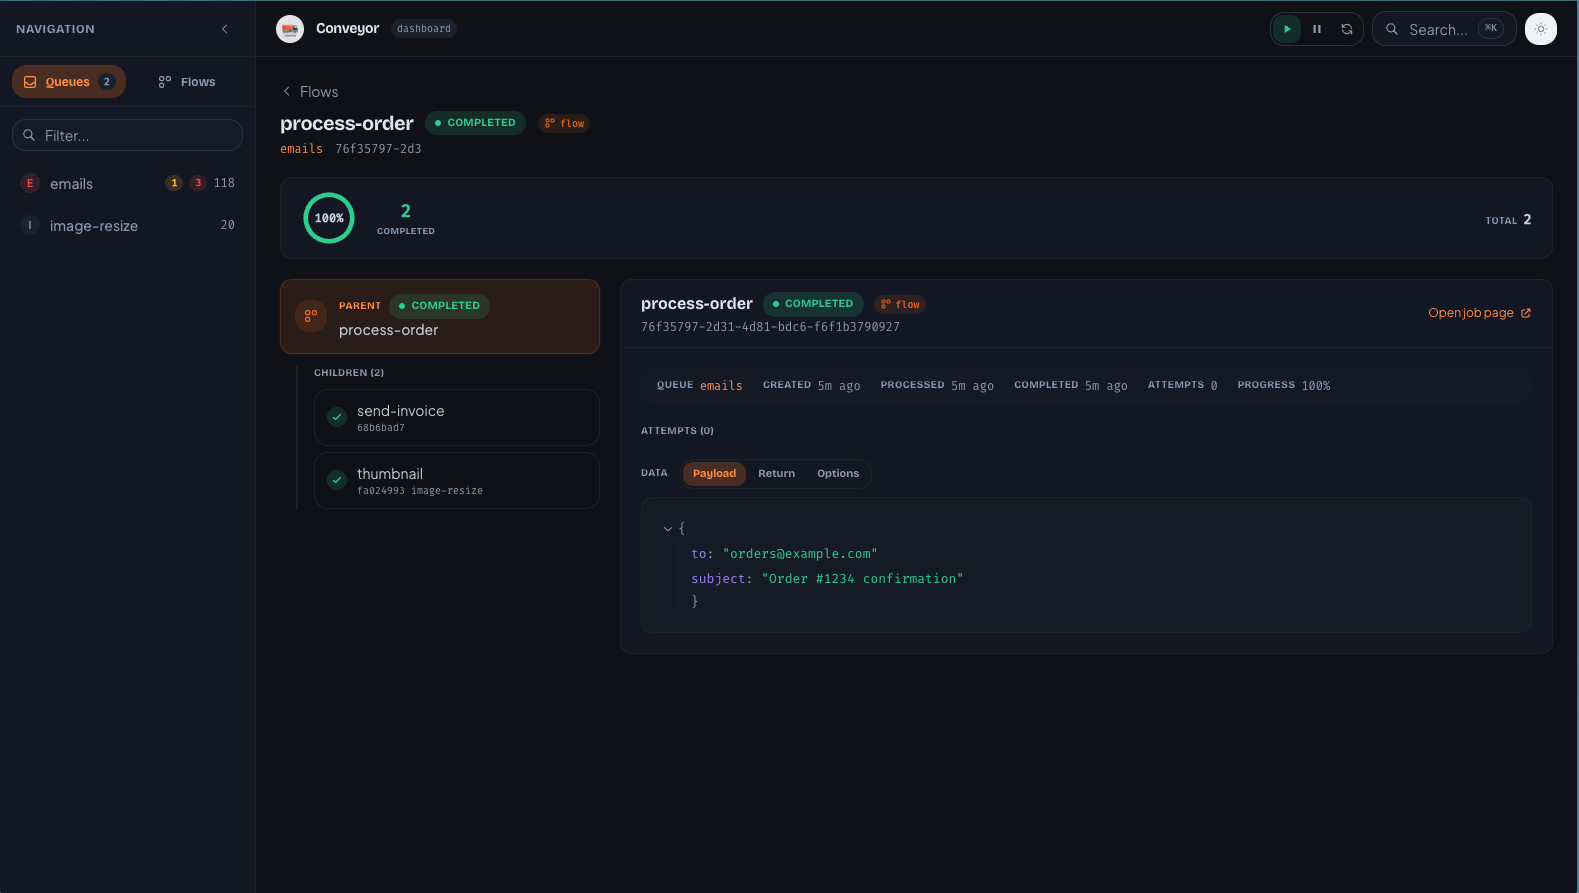
Flow Detail
Two-column view with flow tree on the left and selected job detail on the right. Progress ring shows completion status.
Next Steps
- Setup & Configuration -- installation, options, and framework integration
- Client SDK -- typed HTTP + SSE client for custom integrations
- API Reference -- full REST endpoint documentation